NFL Stats Experience
Role: UX Designer
Tools: Sketch, Invision, Usertesting.com
In my time at the NFL, user research has yielded one consistent insight —- fans primarily use NFL products to find high-quality, timely information and data about their favorite team or players. The stats section, however, has fallen short of this expectation. In order to build a meaningful and efficient stats experience, I sought to uncover how an NFL fan, especially one whose behavior is primarily stats-driven, would interact with different renditions of this information.
Problem
- The stats experience is outdated
The current visual has maintained the same look since 2012, largely using the same patterns it did even further back in time, to 2004. - Lowest site visits of all utility pages on NFL.com
Looking at the analytics, compared to all of the NFL's utility pages (Game Center, Schedules, Standings, Players and Scores), the stats section is the least visited. - Regarded as generally inaccurate or unreliable internally
After conducting internal reviews of the experience, we came to discover the NFL stats team readily avoided using our stats page, labeling the data "inaccurate and unreliable." - No personalization
Past user research has proven that fans want an intensely personal experience, one where their favorite teams and fantasy teams are prominently displayed.
Methods
Understanding NFL Personas
Prior to my arrival at the NFL, a persona model was developed to identify user fandom and avidity. The “Identity” fan is associated with a deep, almost religious attachment to their favorite teams, while an "Expertise" fan is associated with competition —- usually in the form of fantasy- or gambling-related behaviors.
During my study, I was able to single out three dimensions to distinguish the difference between the "Identity" and "Expertise" fan:
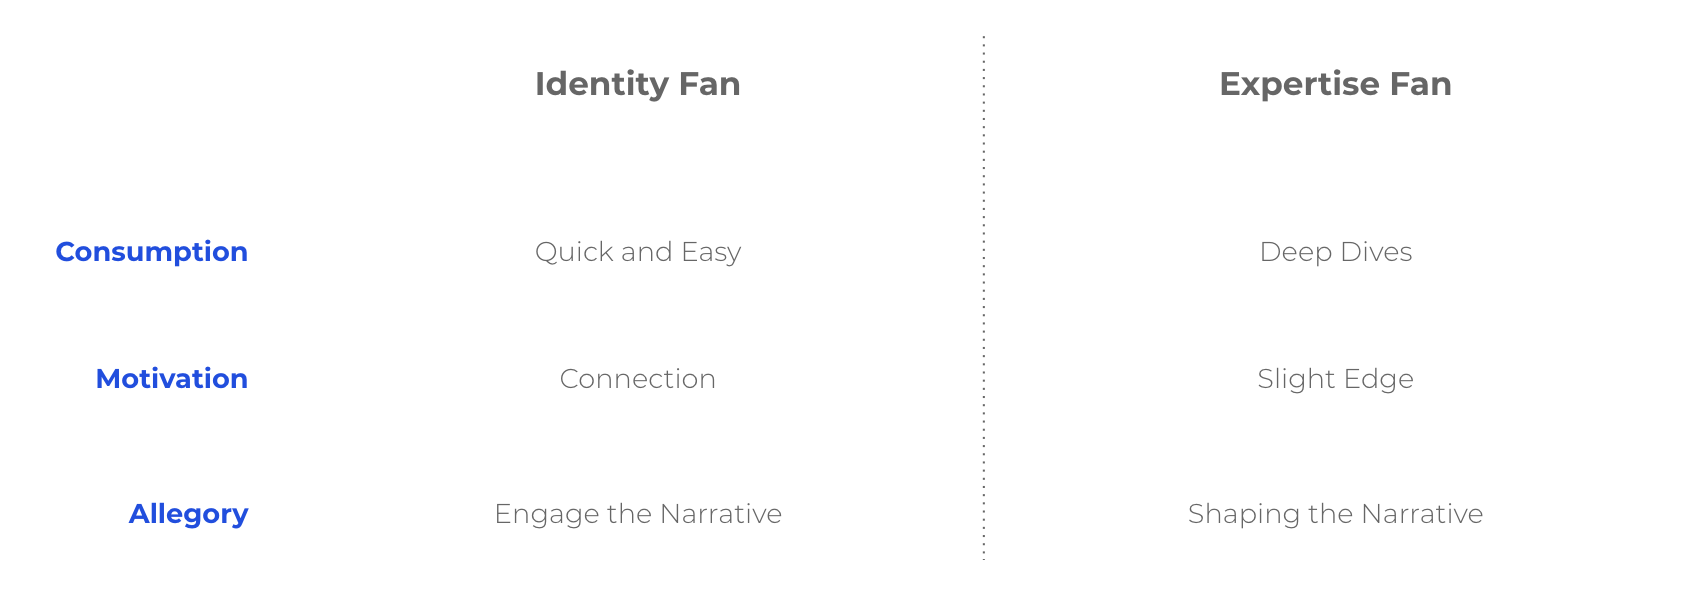
As you will see below, this model helped inform the section's architecture and flow.
Gathering Data
To start the project, I launched a generative study to better understand stats-related behavior in fans. The results provided the following valuable insights:
- Fans want the most up-to-date information on which to base their decisions, mostly for fantasy- or gambling-related activity.
- Fans largely don't share stats they collect, deeming the time and effort they put into their research essential to their personal success in fantasy and gambling.
- The more intense, stats-driven fans often filter, organize and sort the data they collect; some go so far as to build their own complex spreadsheets to gain insight, and thus an advantage in their fantasy leagues.
- Finally, fans overwhelmingly used ESPN to find the data, citing their familiarity to the platform and reliability as the reasons why. Other sources included pro-football-reference.com, Yahoo! Sports and Fox Sports.
Concepting Ideas
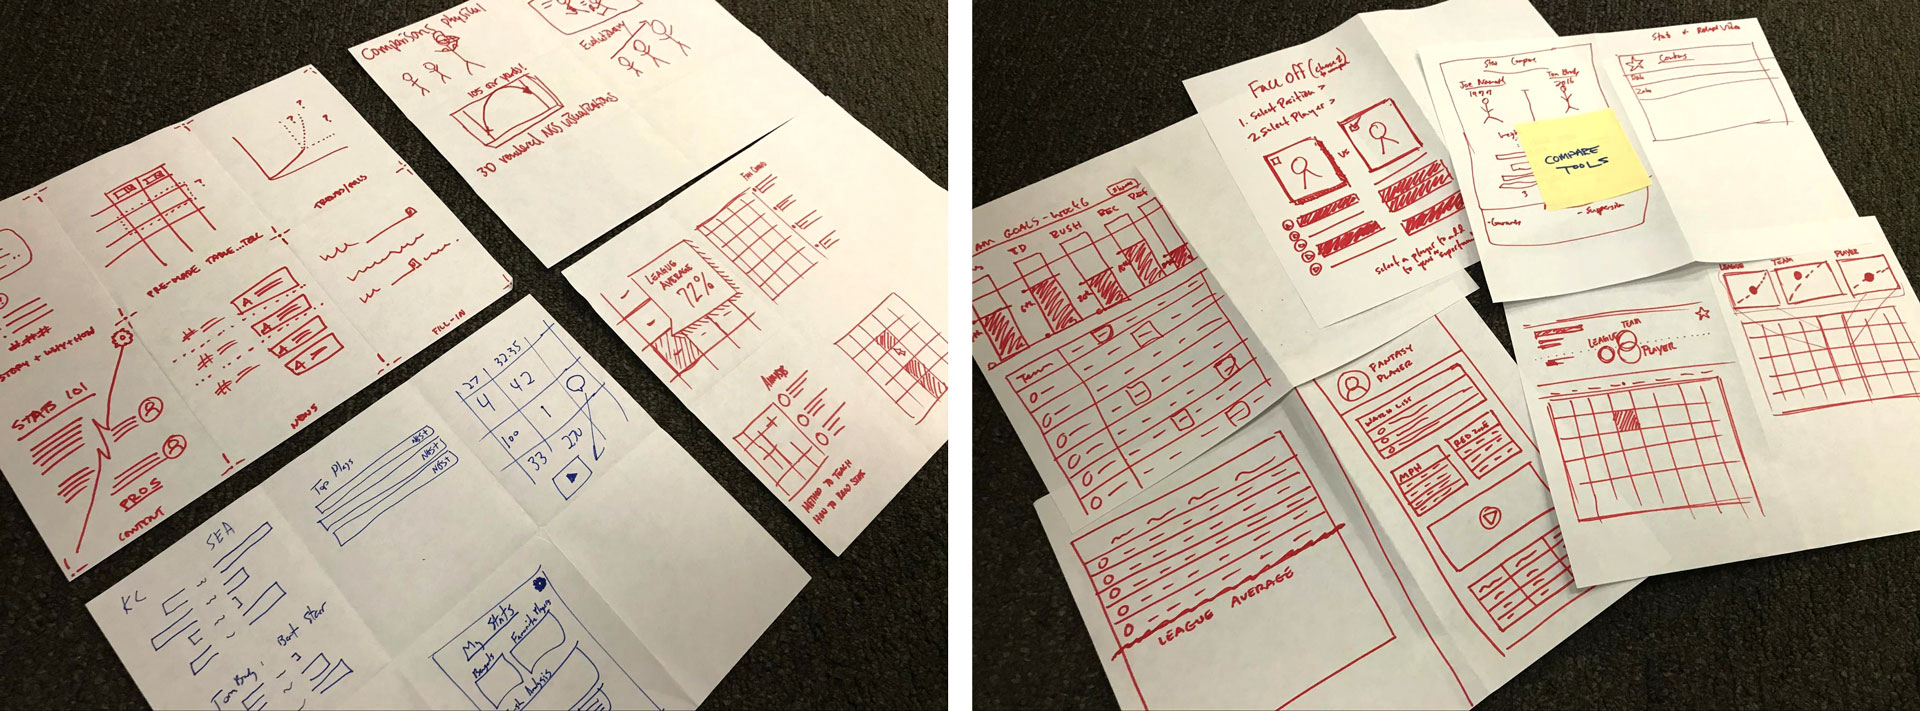
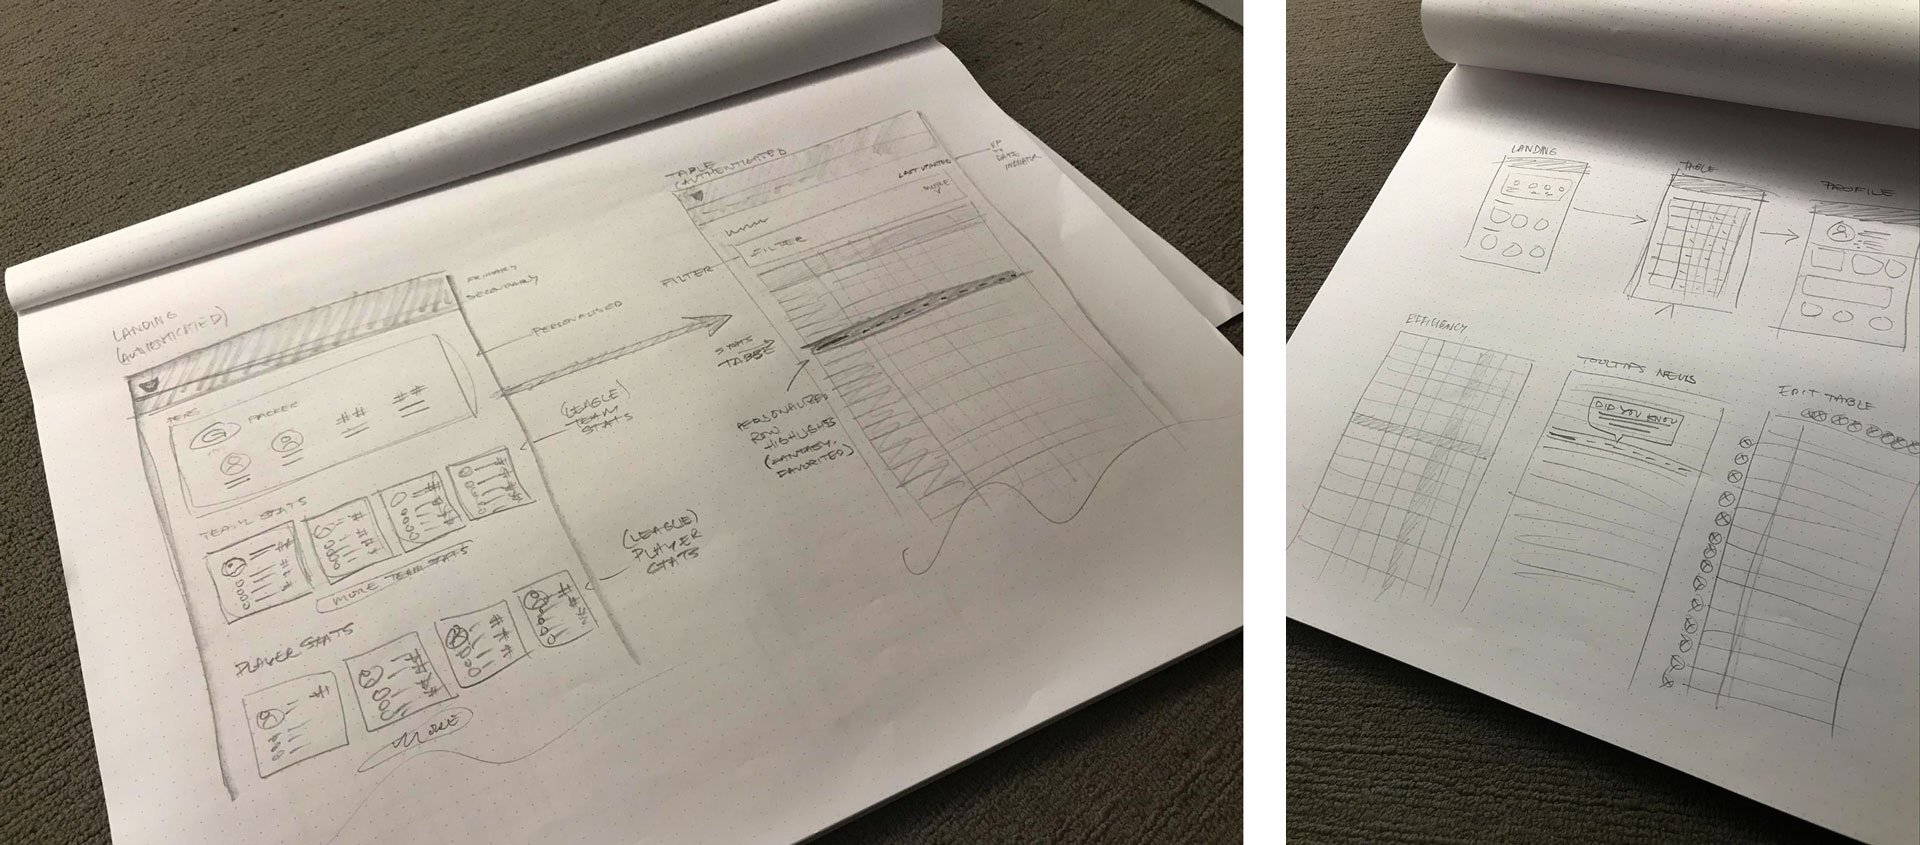
Next, I brought together various stakeholders to conduct a design studio to share my findings and generate ideas. We started by discussing some “How Might We's” and dot-voting on the best ideas, then jumping into a sketch session. The following images are examples produced from that session:
Determining User Flow
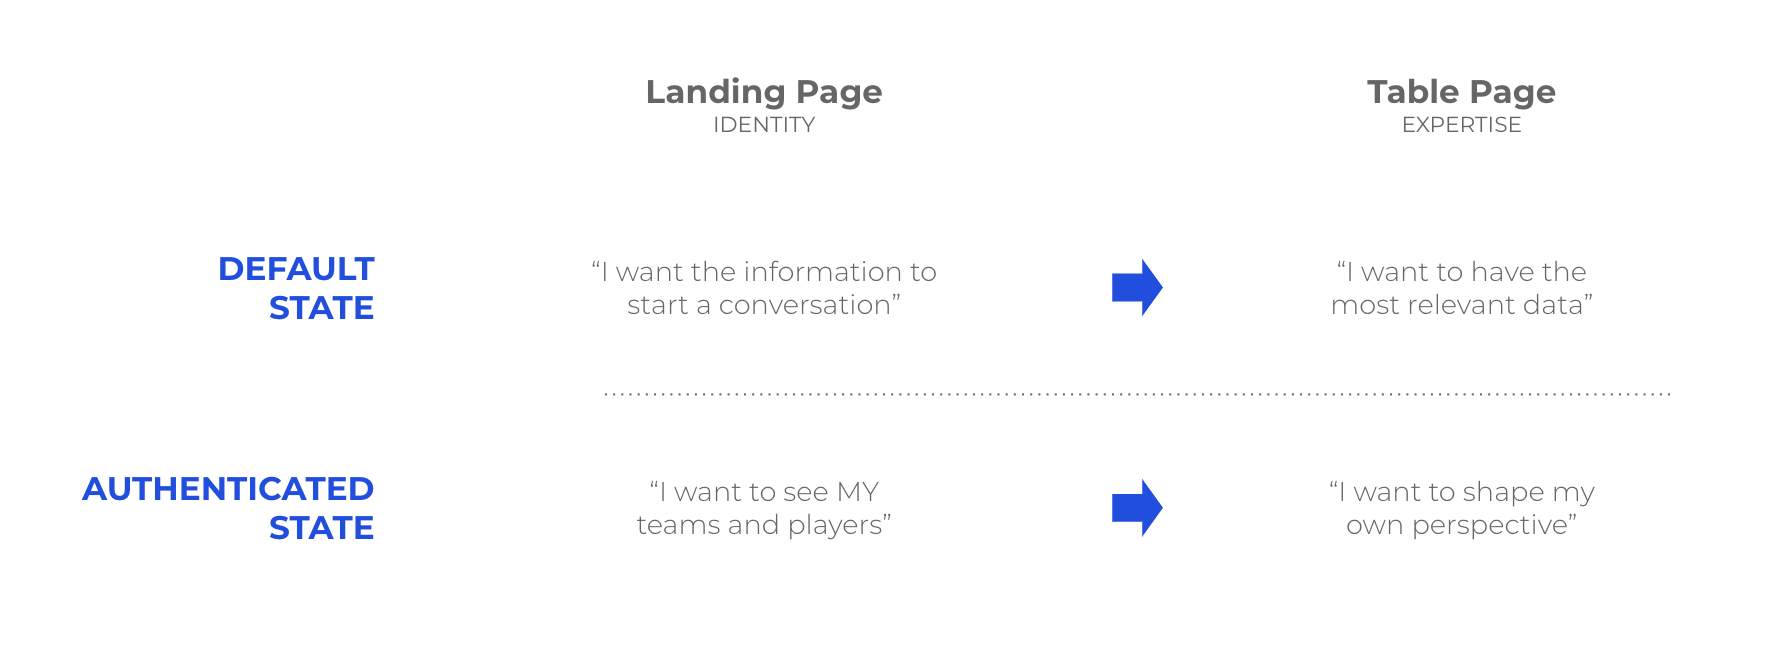
Using our persona model, my generative study and stakeholder input as a base for the interaction (see above), we conceived four user focuses we wanted to serve and design for:
- "I want the information to start a conversation with other football fans"
"Identity" fans don’t need the in-depth stats story, they need abridged, basic information to serve their purpose. - "I want to have the most relevant data"
"Expertise" fans want more than just the surface-level data, they want tabular data extensive enough to make decisions. - "I want to see MY teams and players"
"Identity" fans want their favorite and/or fantasy teams’ stats available to them, not just the general, league-wide collection of data. - "I want to shape my own perspective"
"Expertise" fans want to manipulate and edit the data they gather to aid in their research.
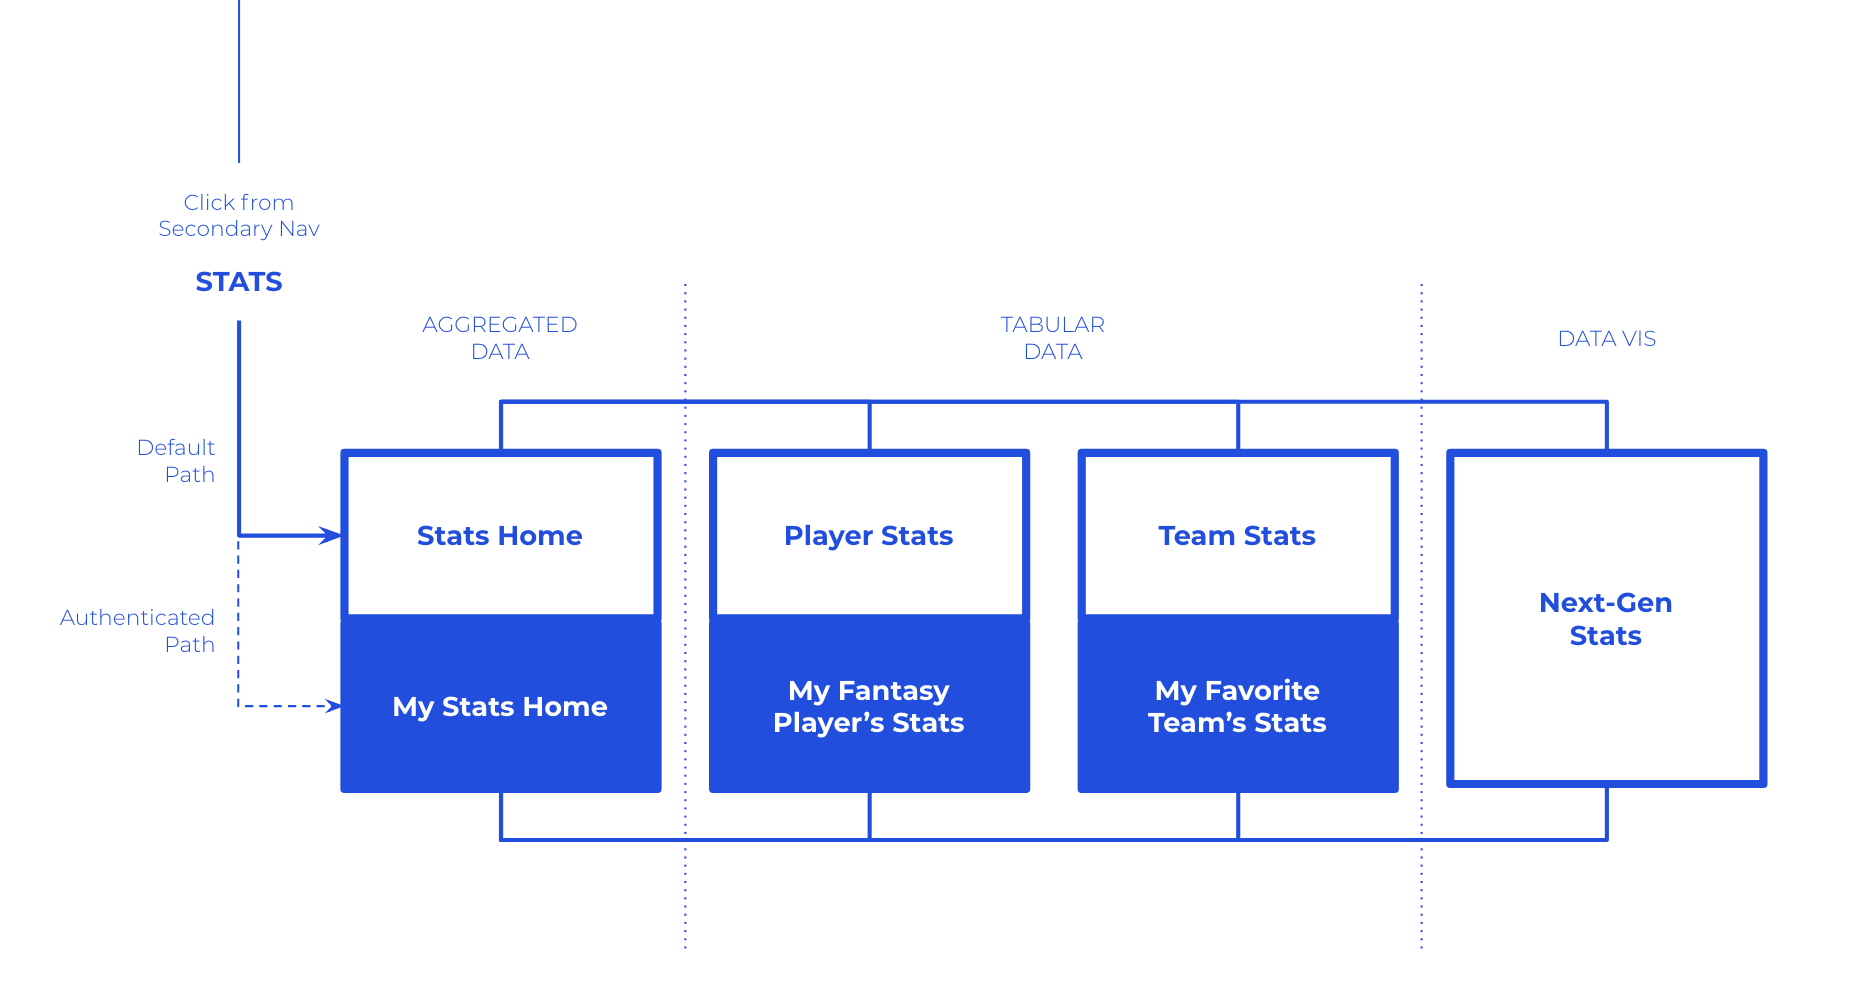
These user stories shaped the IA model for the stats section, allowing for both default and authenticated states that appeal to each persona.
Sketches
Low-fidelity sketches were drawn for initial concepting:
Solution
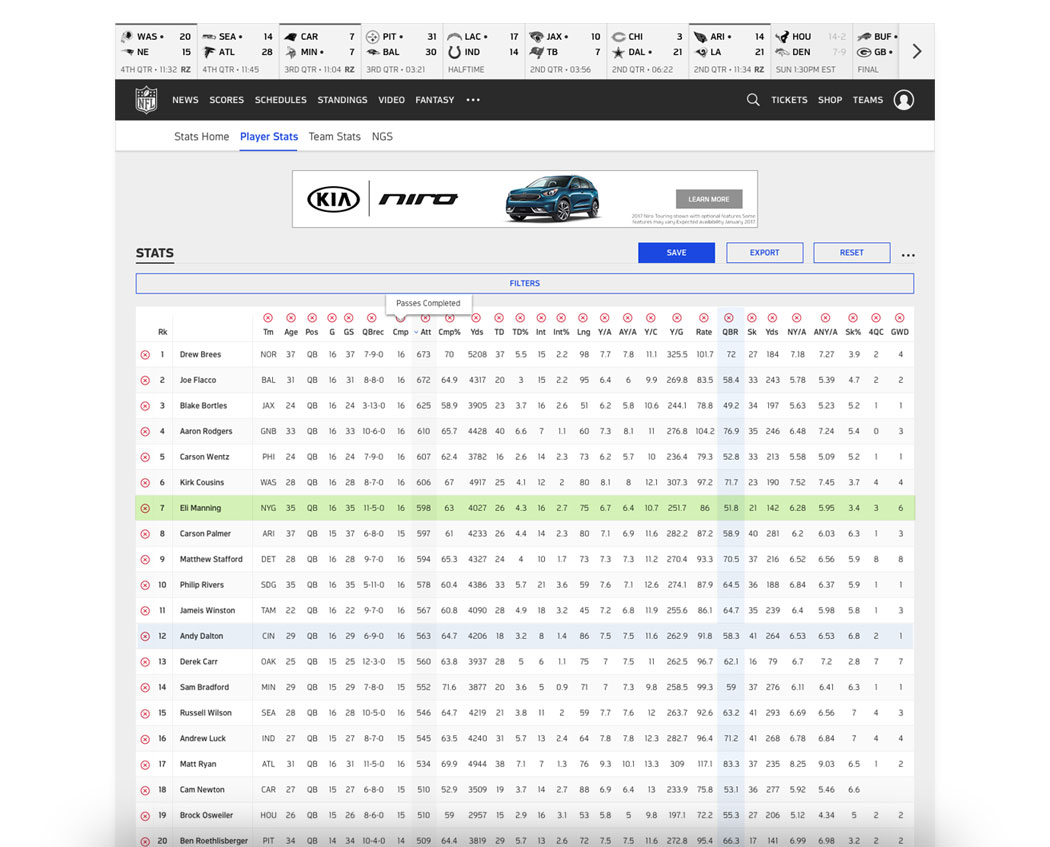
Features include:
- Highlighted row/column “crosshairs” to quickly locate your cursor on the table
- Column header acronym tooltips to decode acronyms
- Glossary of stats terms
- “Last Updated” timestamp
- Fantasy Player row highlight
- Favorite Team row highlight
- Modifiable tables (Save, Export, Edit and Reset)
Link to Invision Prototype